Breast Cancer Prediction
Machine Learning Project
Data Cleaning and Preprocessing
Cleaning Steps:
Data Preprocessing:
Feature Analysis
Feature Analysis
1. Diagnosis Feature
When considering the description of the dataset attributes “Malignant (M)” and “Benign (B)” are the two classes in this dataset which use to predict breast cancer.
The alternate features represent different attributes of breast cancer risk that may be used to classify the given situation which causes breast cancer or not.
“Diagnosis” is the feature that contains the cancer stage that is used to predict which the stages are 0(B) and 1(M) values, 0 means “Not breast cancerous”, 1 means “Breast cancerous”.
2. Correlation Select Features
An objective of the project is to reduce the number of features required to make an accruate model, and reduce the multicollinearity.
The CorrelationWithDiagnosis plot (below) indicates that the "Worst" features generally have a high correlation with the outcome.
In addition, the charts reveal two sets of highly correlated features:
-"Size" features, which include Radius, Perimeter, and Area
-"Shape" features, which include Concavity, Concave points, and Compactness
Based on these observations, we selected the seven features below:
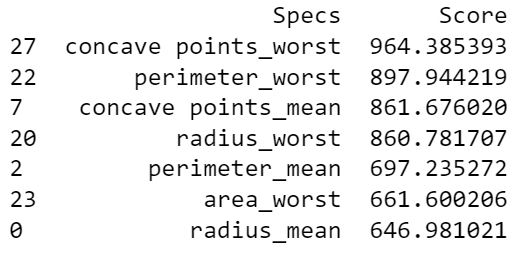
3. SelectBest Function Select Features
Another way to select seven features is based on SelectBest Function:
SelectKBest takes as input the number of desired features, k. SelectKBest then scores all the features in the original X dataset using an ANOVA based function.
The scores represent the ratio between explained and unexplained variance; the higher the score, the more informative the feature is for the data set.
The function removes all but the k highest scoring features, so that the final output is the k best features to select for best modeling.